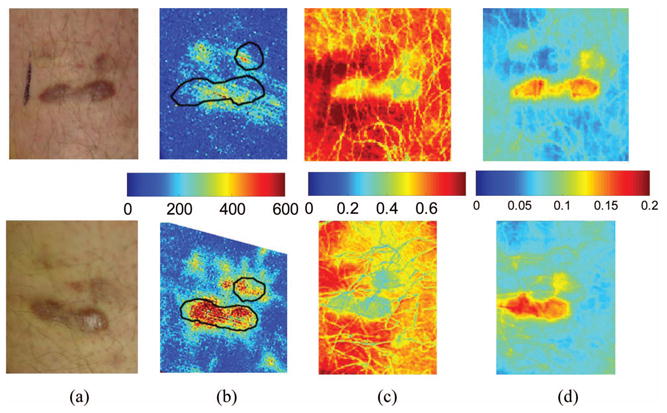
Fig. 9.

Images of Kaposi’s sarcoma subject (top row) on entry onto drug treatment protocol and (bottom row) after 3 weeks of experimental therapy: (a) digital image; (b) laser Doppler image showing blood flux; (c) reconstructed map of fraction of oxygenated hemoglobin; and (d) reconstructed map of fraction of blood in tissue. The lesions appear hypoxic compared to the surrounding, but the laser Doppler and blood volume images show higher blood flux and volume in the lesions.
