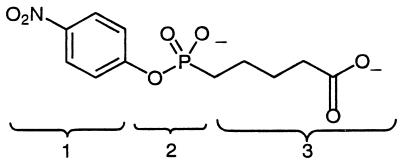
Table 3.
Electrostatic interactions between hapten and antibody
| kcal/mol
|
||
|---|---|---|
| Germ line | Mature | |
| Head (1) | 18.4 (0.3) | 2.8 (0.3) |
| Phosphonate (2) | −187.6 (0.9) | −234.4 (0.8) |
| Tail (3) | −135.8 (2.1) | −117.5 (1.4) |
| Total | −304.9 (2.5) | −349.1 (1.5) |
Results are mean interaction energies (in kcal/mol) and SEM from 50 configurations. Note that the values in the row labeled “totals” correspond to the 〈ΔEelec〉 and 〈ΔEvdW〉 values shown in Table 1.

