Figure 2.
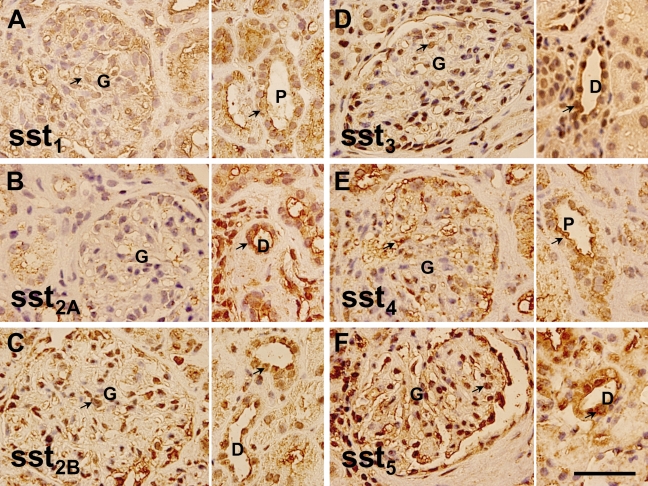
Distribution of somatostatin receptors in normal human kidney. Examples of immunostaining for somatostatin receptor (sst)1, sst2A, sst2B, sst3, sst4, and sst5 are shown in A–F. Left panel shows the glomerular (G) staining and right panel shows the staining of proximal (P) or distal (D) tubules (n=25). Staining is indicated by arrows. Bar = 100 μm.

