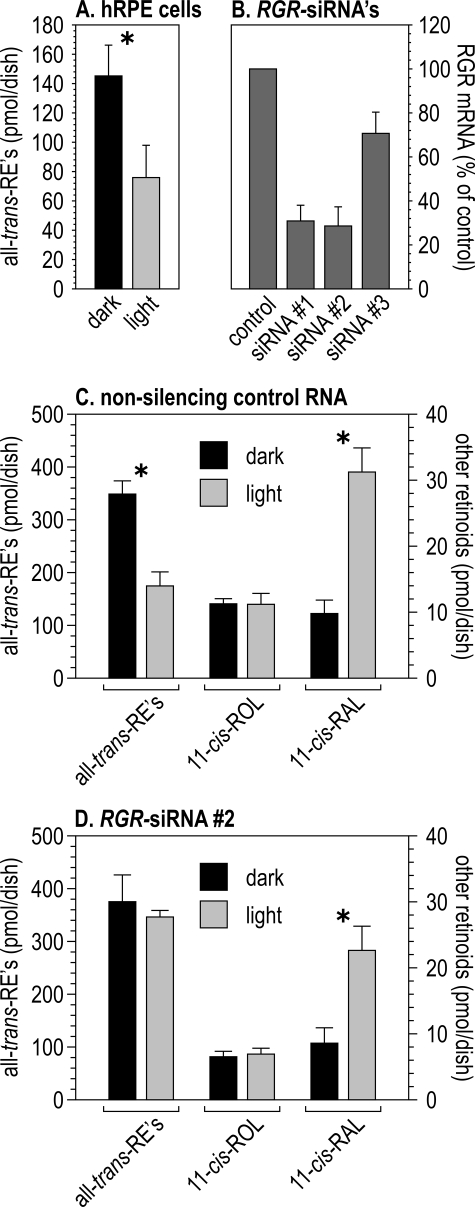
FIGURE 3.
Retinoid levels in cultured human RPE cells. A, levels of all-trans-REs in hRPE cells cultured in the dark or exposed to UV-filtered light for 2 h. Data are expressed as picomoles per dish of confluent cells (n = 4). Asterisk denotes a significant difference between dark and light values (p = 0.032). B, levels of RGR mRNA in hRPE cells from confluent millicell dishes. Cells were transfected with a nonsilencing control RNA (control) or RGR siRNAs 1-3. Quantitation was by qRT-PCR using GAPDH as an internal control. The ΔCt values for each RGR siRNA are expressed as a percent of the nonsilencing control. C, retinoid levels in dark- and light-adapted hRPE cells and media after transfection with the nonsilencing control RNA. The scale on the left is for all-trans-REs (in hRPE cells), and the scale on the right is for 11-cis-ROL and 11-cis-RAL (in the media). Both are expressed as picomoles per confluent dish (n = 4). Asterisks denotes significant differences between indicated values (p = 0.0005 for all-trans-REs and p = 0.002 for 11-cis-RAL). D, retinoid levels in dark- and light-adapted hRPE after transfection with RGR siRNA 2. Quantitation was the same as in C. Asterisk denotes a significant difference between 11-cis-RAL values (p = 0.017).

