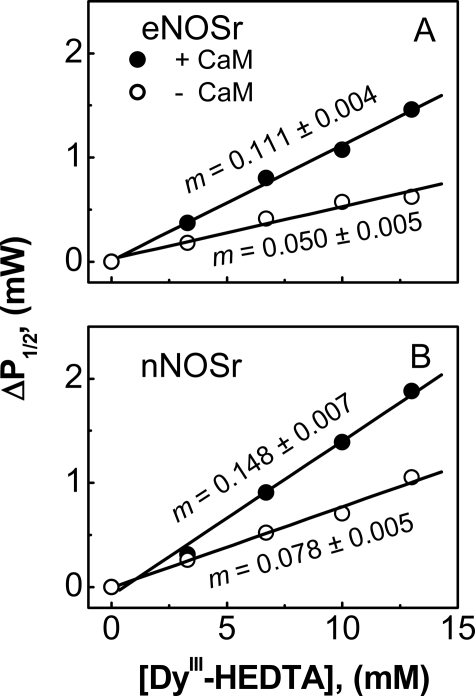
FIGURE 5.
Comparative shielding of the FMNsq radical in eNOSr and nNOSr as measured by EPR spectroscopy. EPR power saturation measurements were recorded at 150 K for either NOSr protein in the presence of the indicated concentrations of DyIII-HEDTA, and the ΔP½ values were calculated as described under “Experimental Procedures.” Values of ΔP½ for eNOSr (A) and nNOSr (B) are plotted versus [DyIII-HEDTA] in the presence (filled circles) or absence (open circles) of bound CaM. The lines of best fit were calculated by linear regression, and the slope of the lines, m (milliwatts/mm), was determined. Data are representative of at least two experiments.

