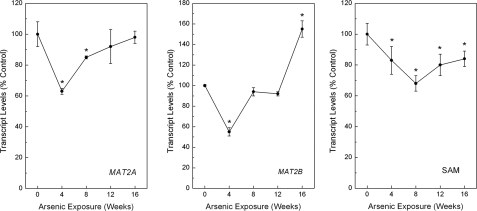
FIGURE 2.
Levels of MAT2A (left panel) and MAT2B (middle panel) transcript and cellular SAM (right panel) in RWPE-1 cells during progressive arsenic adaptation. The data are expressed as means ± S.E. (n ≥ 3) and given as percentages of control (100%) expression after normalization to GAPDH. An asterisk indicates a significant difference (p ≤ 0.05) from control.

