
Figure 2.
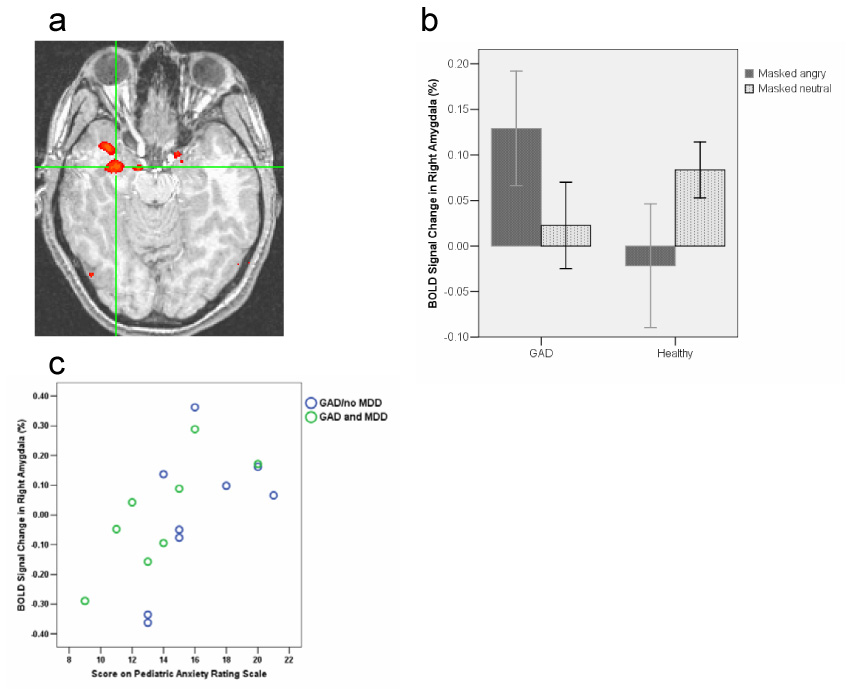
a. In the comparison of trials in which the angry face appeared relative to trials with neutral faces, youth with GAD show greater activation than controls in the right amygdala (right is left and left is right). Coordinates (xyz) for peak activation are 28 −1 −18. b. Bar graphs depicting activation to masked angry and neutral faces separately by group (error bars indicate standard errors of the mean). Bar graphs represent mean activation within the amygdala cluster. Within subject post-hoc t-tests showed that GAD participants had a significantly greater activation to masked angry faces relative to masked neutral faces, t(16) = 2.47, p = .025, and there was no significant difference in healthy comparisons between masked angry and masked neutral faces, t(11) = 1.29, p = .22. c. Relationship between patients’ BOLD response in right amygdala and severity of anxiety symptoms (PARS), Pearson r =.60, p=.01. The location of the amygdala cluster of activation (xyz coordinates 18 −5 −10) is distinct from the cluster in a. GAD patients with and without MDD are differentiated.