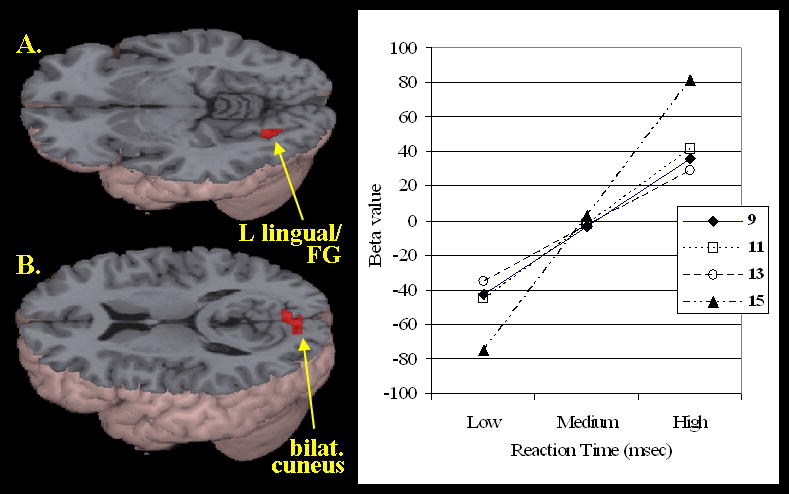
Figure 4.

Age differences in activation as a function of reaction time (see Table 4 for coordinates). Positive relationship between within subject individuals' reaction time (in milliseconds) and between subject activation increases with age in A) the left lingual/fusiform gyrus (BA 18) and B) the bilateral cuneus (BA 18), in the O+P- condition. The graph to the right shows increasing activation in the left lingual/fusiform gyrus as a function of reaction time across four age groups (9, 11, 13, and 15) in the O+P- condition, with the strongest correlation in the 15-year-old group.
