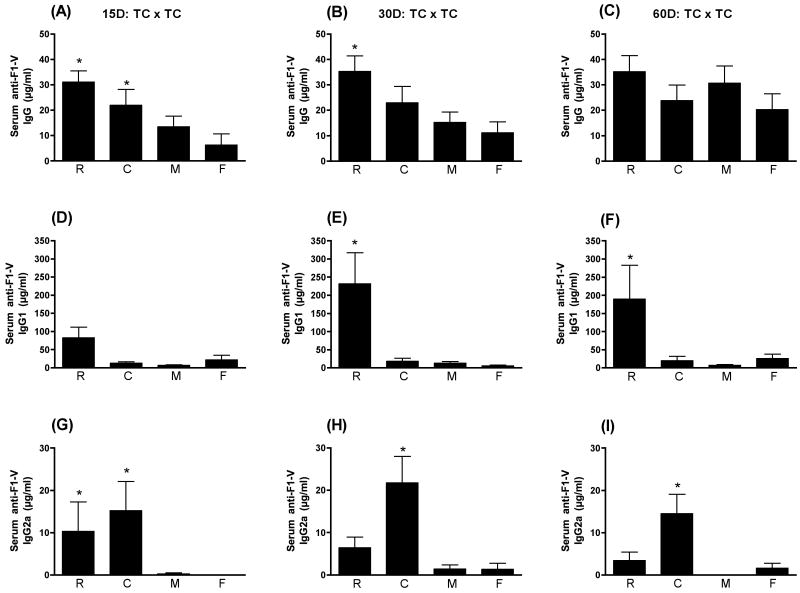
Figure 5.
Serum anti-F1-V responses following TC immunization. Swiss Webster mice were immunized at day 0 and 28 transcutaneously with F1-V alone (F) or in conjunction with LT(R192G) (R), CpG ODN (C), or MPL®TDM (M). Ten animals from each group were sacrificed on days 15, 30 and 60 post final immunization. Serum was collected by cardiac puncture. Concentrations of IgG (panels A, B and C), IgG1 (panels D, E and F) and IgG2a (panels G, H and I) were determined by ELISA by non-linear regression against standard curves. Error bars represent ± SEM. Adjuvant enhanced responses that are significantly different (p≤0.05) than antigen alone are indicated with an asterisk (*).

