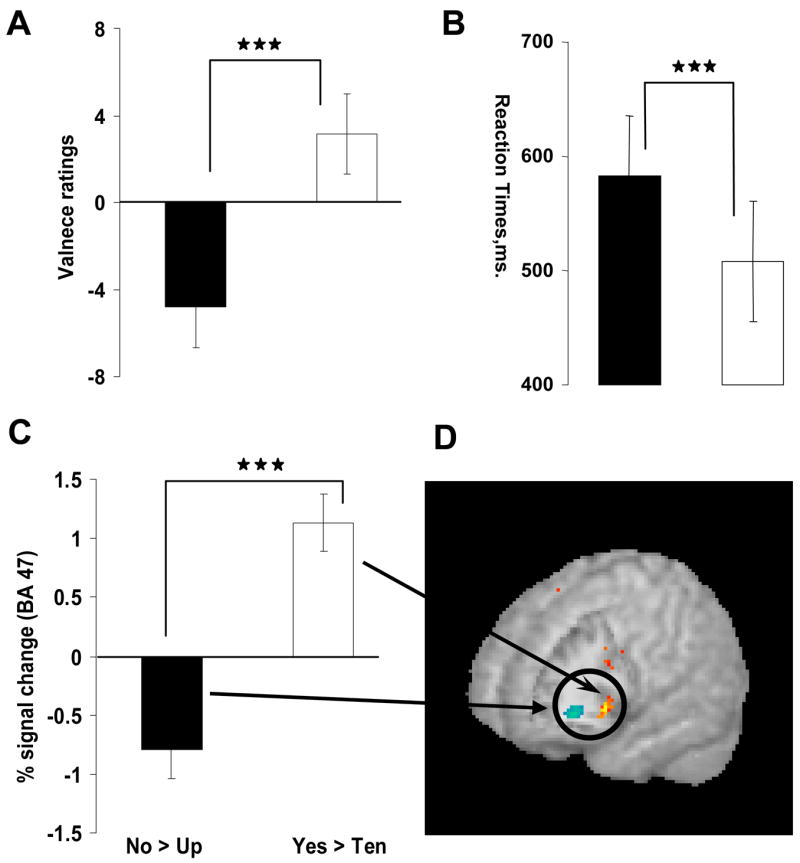
Figure 2.

Differential brain and behavioral responses to No and Yes (N = 23). (a) Post-scan ratings of valence (−10 most negative to +10 most positive) to the contrasts No-Up (black bar) and Yes-Ten (white) (non-parametric Wilcoxon, Z = −4.6, p < 0.0001). (b) Reaction-times to the contrasts No-Up (black bar) and Yes-Ten (white) (t = −5.5, p < 0.0001). Note, the y axis starts with 400 ms. (c) percent signal change in the right lateral OFC, BA 47, for -No-Up (Talairach coordinates: 30, 33, −3) and Yes-Ten (coordinates: 33, 30, −9), t = −5.9, p < 0.0001. Error bars at a–c represent ± standard error. (d) Corresponding image.
