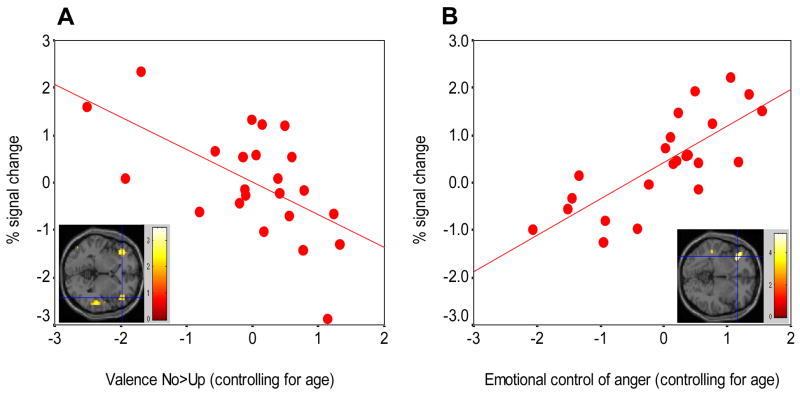
Figure 3.
Correlations between behaviors, corrected for age, and BOLD changes (z-scores) in the lateral OFC in response to No. (a) Scatter plot shows association between the BOLD signal change for -No-Up in the right OFC (x = 42, y = 36, z = 9) and valence No-Up with a linear regression line (r = −0.59, p < 0.001) and with an imbedded corresponding image. The left OFC activation was not significant (b) Correlation between control of anger and BOLD signal change for No-baseline in the right OFC (x = 36, y = 30, z = −3) and a linear regression line (r = 0.77, p < 0.001) with an imbedded corresponding image (Left = Right).

