
FIG. 1.
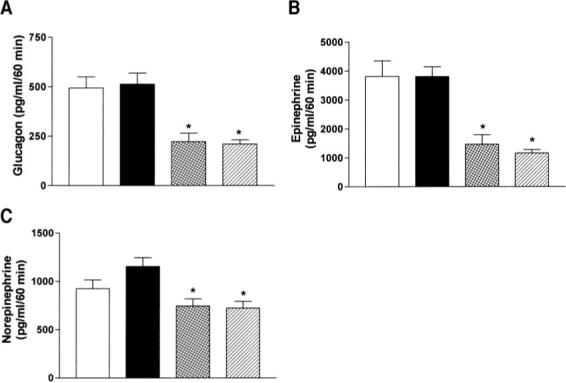
Day 2 plasma glucagon (A), epinephrine (B), and norepinephrine (C) levels (t = 60) in response to insulin-induced hypoglycemia after antecedent (day 1) saline (□), antecedent hindbrain glucoprivation (■), antecedent recurrent hypoglycemia  , or antecedent third ventricular glucoprivation
  . Data are expressed as means ± SE. *P < 0.05 vs. SH.