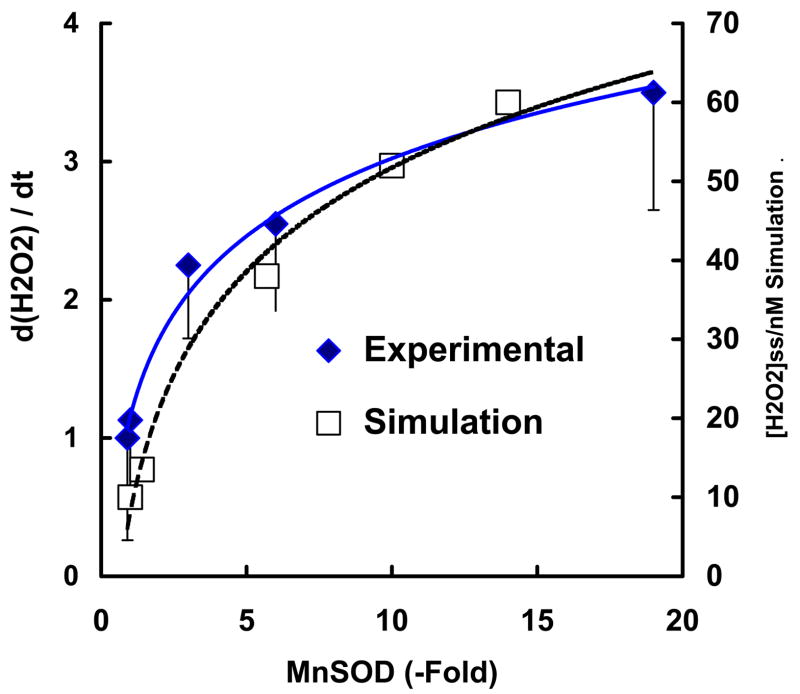
Figure 3. The rate of accumulation of H2O2 in the media increases with the cellular MnSOD activity.
(♦) The H2O2 released from MCF-7 cells and several clones overexpressing MnSOD (1.1-, 3-, 6-, and 19-fold) in exponential growth was determined at several time points over a period of two hours. The concentrations of H2O2 in the medium were measured using Amplex red. The ordinate represents the change in the [H2O2] in the media versus time compared to wildtype MCF-7 cells (1 on the left ordinate scale represents 2.8 zmol cell−1 s−1). Results are from three independent experiments ± standard deviation.
( ) The mitochondrial steady-state level of H2O2 (nM) from the kinetic model achieved with different levels of MnSOD (0.7–10 μM) as presented in Figure 4D.

