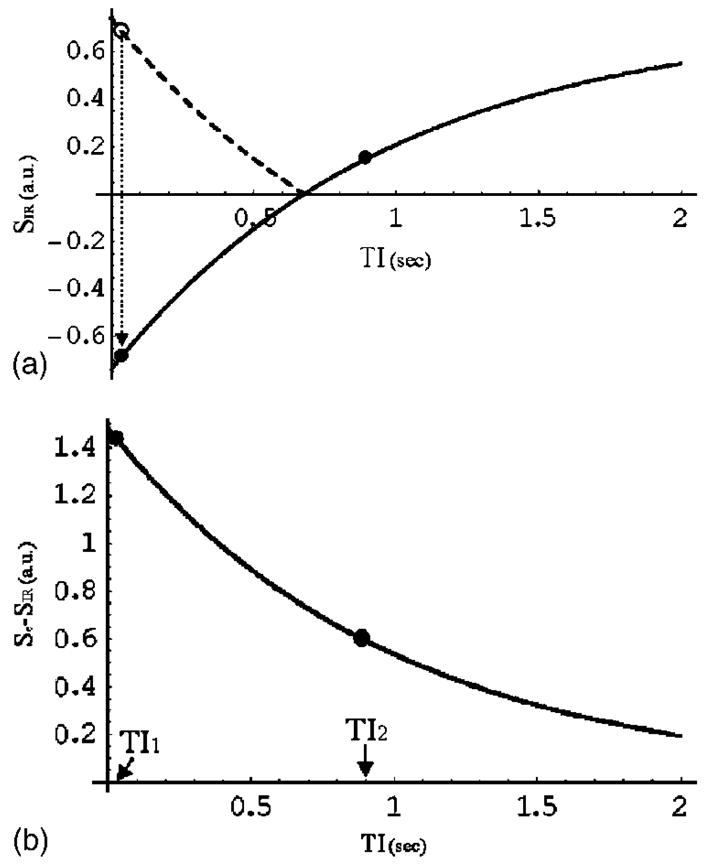
Fig. 1.

Simulation of the signal intensity of the inversion recovery sequence as a function of inversion time (TI) (A) and the difference signal intensity of Se − SIR (B). The parameters used were TE=15 ms, S0 =1.0, T2 * =50 ms, and T1 =980 ms for human gray matter at 1.5 T. In (A), the heavy dashed line before the zero crossing represents the absolute value of SIR. The two dots represent the inversion times, TI1 and TI2, used to calculate T1m from the difference signal.
