
Fig. 4.
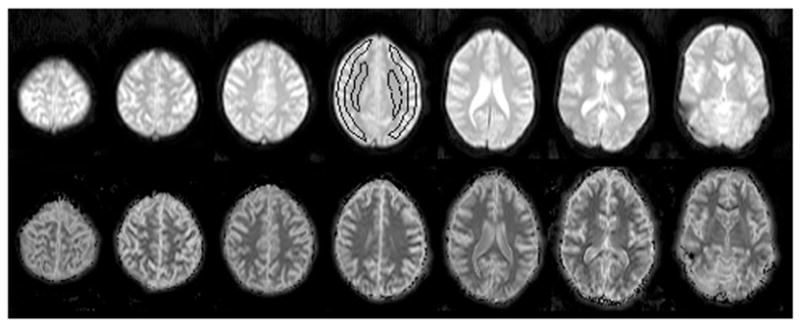
Images from one normal volunteer without inversion preparation (reference Se images, top row) and corresponding T1m maps (bottom row) for seven slices. Representative ROIs of gray matter and white matter were drawn on the middle slice out of seven slices as indicated in the figure. Slices 3 to 6 were used to measure average T1 values in each subject.