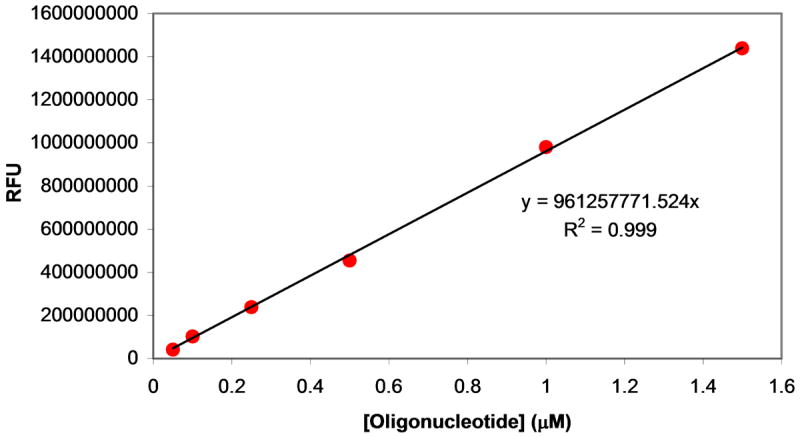
Figure 2.

Construction of a calibration curve. Labeled oligonucleotides corresponding to products formed by cleavage of the fluorescently-labeled oligonucleotide substrate by MazF were mixed at 1:1 molar ratios for various concentrations. Fluorescence values for these 1:1 mixtures in elution buffer were measured upon excitation at 485 nm and emission at 530 nm allowing a calibration curve to be constructed that relates fluorescence to the amount of oligonucleotide cleaved. Calibration curves were linear up to 60 pmol (2 μM) of each cleavage fragment; a calibration curve was constructed in parallel with every experiment.
