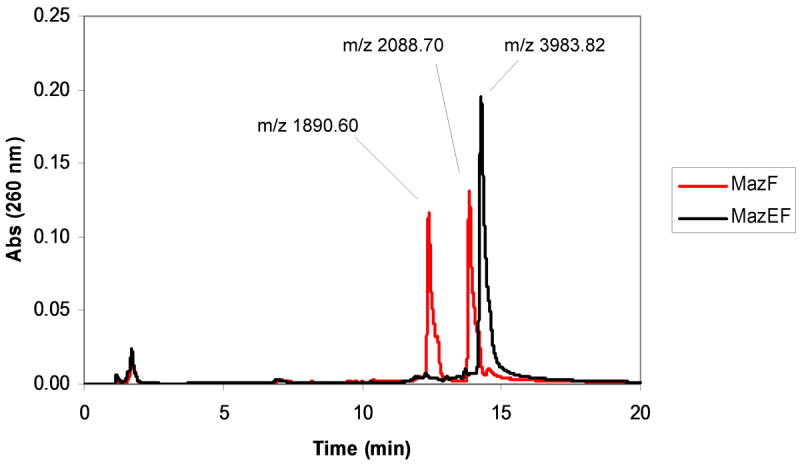
Figure 4.

Verification of substrate cleavage by HPLC. Products from a 5 hour incubation of 24 μM unlabeled chimeric oligonucleotide (5′-AAGTCrGACATCAG-3′) with 11.5 μM MazF(His)6 in the presence (black) and absence (red) of 5.75 μM MazE were observed by HPLC analysis. Peak fractions were analyzed by MALDI mass spectrometry. The peak at longest retention time corresponds to intact oligonucleotide (calculated MW = 3983.6). The peaks at shorter retention times correspond to 5′- and 3′-fragments generated from MazF cleavage (calculated MW = 1894.2 and 2088.4, respectively).
