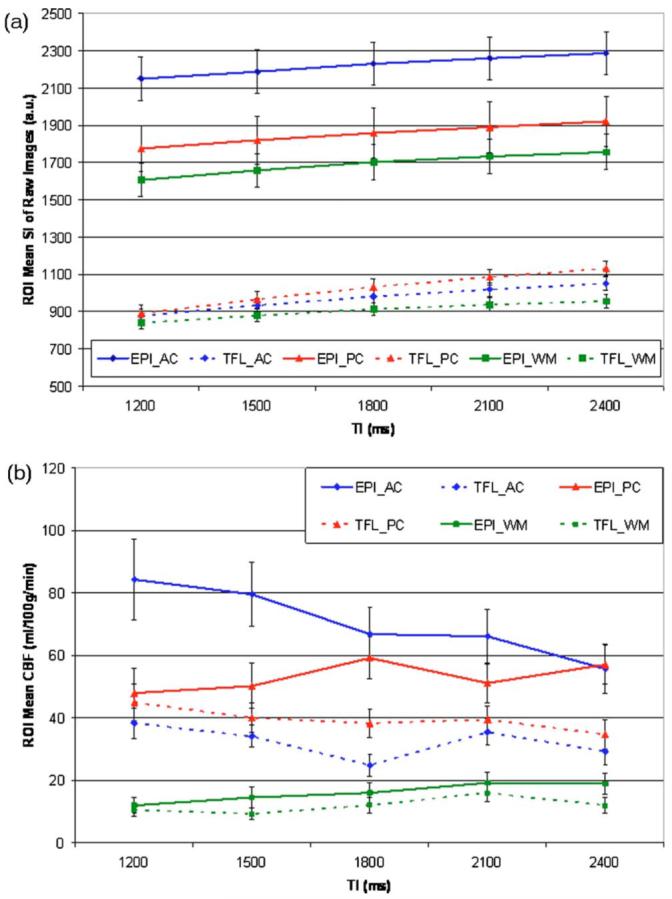
FIG. 4.

Mean changes for the three regions-of-interest (ROI) and for the two sequences as a function of the postlabeling delays time (TI2) averaged over eight volunteers. Three ROIs are anterior cingulate (AC), posterior cingulate (PC), and central semiovale (WM). (a) Mean signal intensities (SI) and the corresponding standard deviation (STD) of raw control and labeled images for three ROIs over eight volunteers. (b) Mean cerebral blood flow (CBF) values with the standard errors (STD/square root of number of volunteers) obtained in three ROIs and calculated for individual postlabeling delay time (TI2) over eight volunteers.
