
Figure 1.
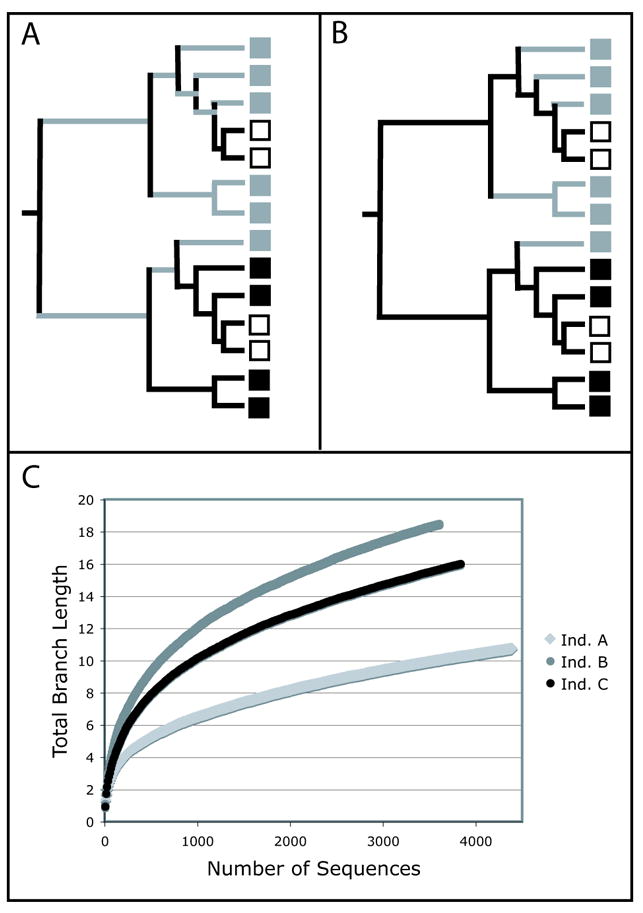
Estimates of Phylogenetic Diversity (PD) and PD Gain (G) for the grey community. The boxes represent taxa from the black, white, and grey communities. (A) PD is the sum of the branches leading to the grey taxa. (B) G is the sum of the branches leading only to the grey taxa. (C) PD rarefaction curves showing the increase in branch length with sampling effort for the intestinal and stool bacteria from three healthy individuals. Aligned16S rRNA sequences from the three individuals were available with the Supplementary Materials in (Eckburg, et al., 2005). The Arb parsimony insertion tool was used to add the sequences to a tree containing over 9,000 sequences (Hugenholtz, 2002) that is available for download at the rRNA Database Project II website (Maidak, et al., 2001). The curves represent the average values for 50 replicate trials.