
Figure 3.
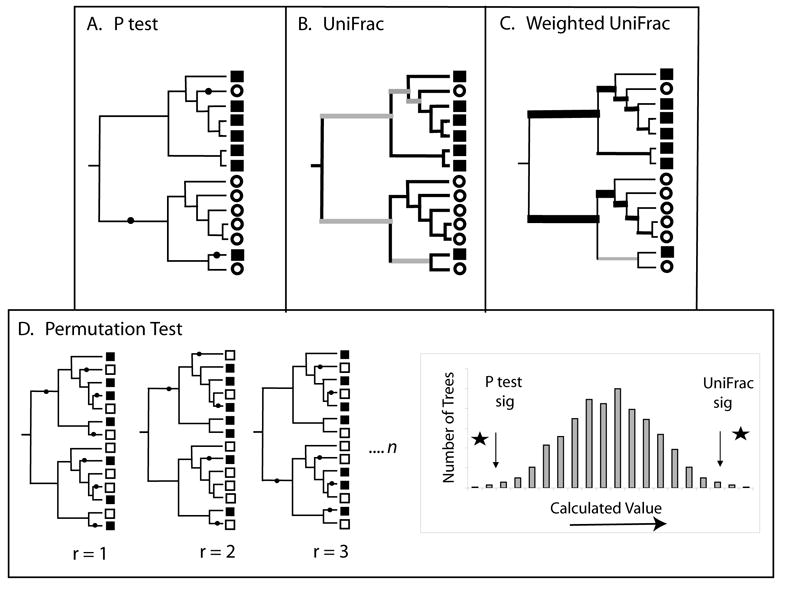
Significance testing with the P test, UniFrac, and weighted UniFrac. The P test and the unweighted and weighted UniFrac significance tests all determine whether two communities are significantly different by comparing a value for the true tree to a collection of random trees and/or trees in which the community labels have been randomly assigned to a constant tree topology. For the P test (A), the calculated value is the minimum number of changes (indicated with black dots) needed to describe the distribution of community labels on a phylogenetic tree (squares and circles denote sequences derived from different communities). For UniFrac (B), the calculated value is the fraction of branch length in the tree that is unique to one community (black branches) verses shared (grey branches). For weighted UniFrac (C), the calculated value is the sum of the branches weighted by the difference in the number of descendants from each community for each branch (represented here by the thickness of the branch). (D) For the P test, the p value is the fraction of the random trees that have a smaller value then the real tree. For both unweighted and weighted UniFrac, the p value is the fraction of the random trees that have a greater value than the real tree.