
Figure 5.
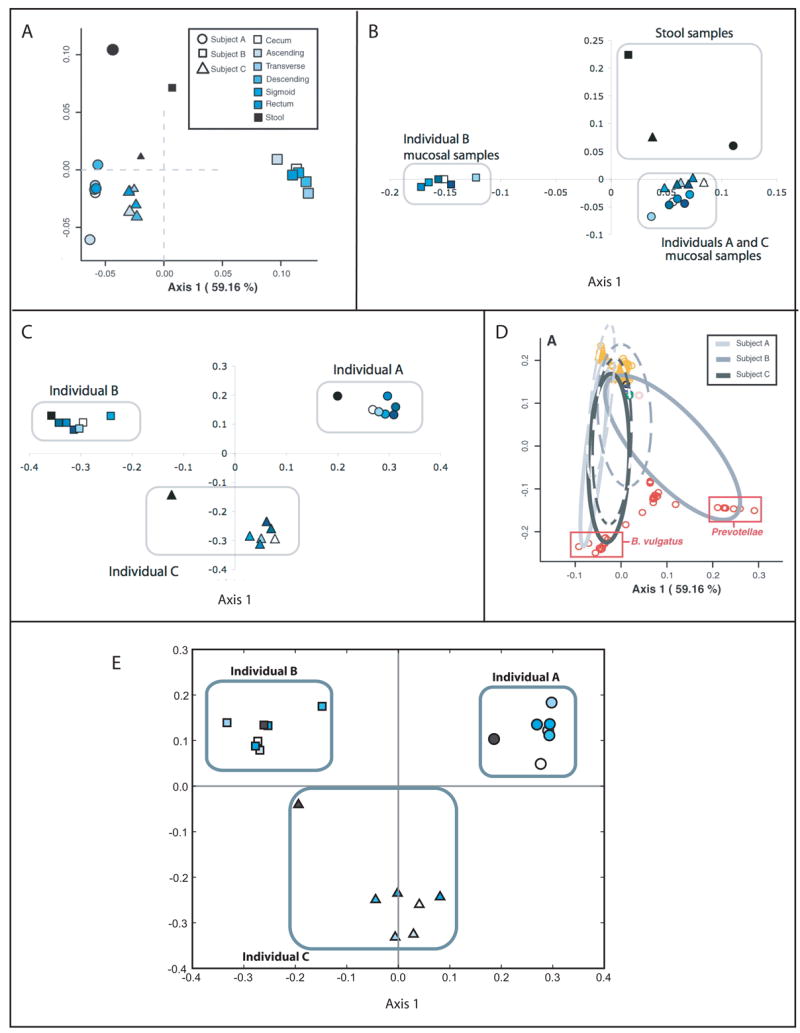
Ordination of human stool and intestinal mucosal samples with DPCoA and UniFrac. (A) Ordination of samples with DPCoA (adapted from (Eckburg, et al., 2005)). Axis 1 separates the mucosal samples of individual B from individuals A and C and Axis 2 separates the stool and mucosal samples. (B) PCoA of weighted UniFrac values (adapted from (Ley, et al., 2005)). The results are almost identical to the DPCoA results from A. (C) PCoA of unweighted UniFrac values (adapted from (Ley, et al., 2005)). Unlike for weighted UniFrac and DPCoA, the stool samples from each individual clusters with the mucosal samples from that individual, indicating that the difference between the stool and mucosal samples is in the relative abundance of lineages rather than which lineages are present. (D) Position of sequences in the same coordinate space used to plot the samples in A. This suggests that the abundance of members of the Prevotellae family in Individual B contributes to the difference with Individuals A and C. (E) PCoA of unweighted UniFrac values calculated from an ARB parsimony insertion tree made with 100 bp sequence regions extending from PCR primer R357 (adapted from (Liu, et al., 2007)). Even with these short sequence reads, UniFrac recaptured the result from the near-full length 16S rRNA sequences.