
Figure 5.
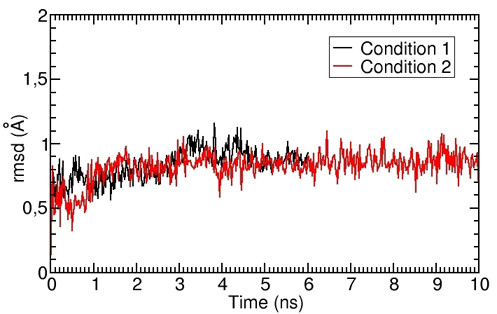
Comparison of two different simulation methods in determining the mobility of TM7. The plot shows the values of rmsd as a function of time obtained in two different simulation protocols, i.e., with NOE distance restraints (Condition 1, 6 ns, in black) or without NOE distance restraints (Condition 2, 10 ns, in red).