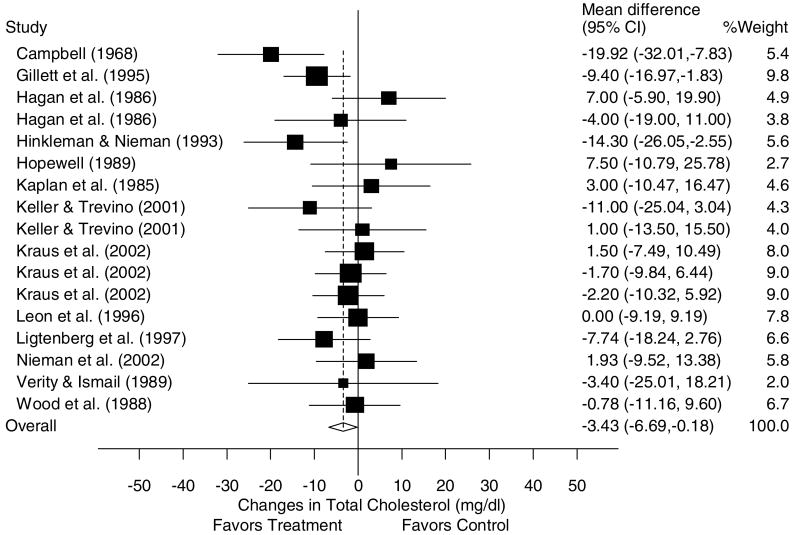
Figure 1.
Forest plot for changes in TC and 95% CI for each outcome as well as the overall weighted mean difference and 95% CI. The size of the black boxes for each outcome represents the weight given to that outcome. The overall mean difference is shown by the middle of the diamond while the left and right extremes of the diamond represent the corresponding 95% CI. The vertical dashed line represents the overall mean.

