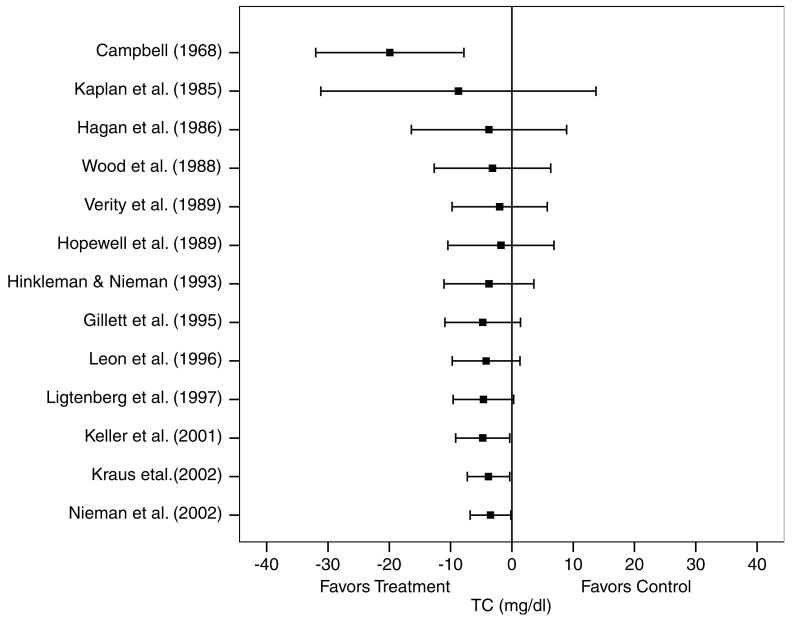
Figure 2.
Cumulative meta-analysis, ranked by year, for changes in TC. Each horizontal line and black square represent the summary of results as studies from the previous years are combined with the listed study. The black squares represent the point estimates while the lines represent the lower (left) and upper (right) 95% CI. Estimates are based on 17 outcomes from 13 studies.

