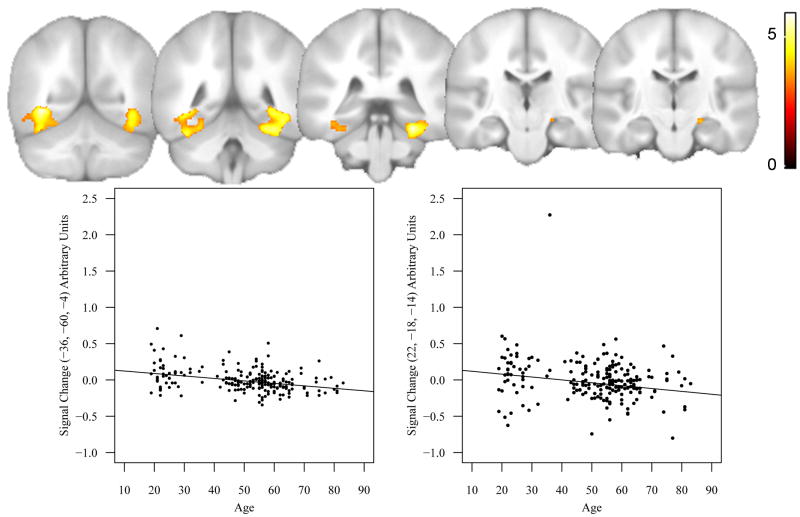
Fig. 2.
The top panel shows the T maps for the results of the multiple regression analysis of aging effects (n = 208) for the ENC task. The statistical threshold was set at p = 0.001, uncorrected for multiple comparisons. The analyses were restricted to voxels that displayed a main effect of task, which are displayed in Fig. 1. Also shown are scatter plots of age-related decline in signal change in the left ventral temporal cortex (left panel) and the right hippocampus (right panel). The adjusted rank-estimation fitted lines are also shown.

