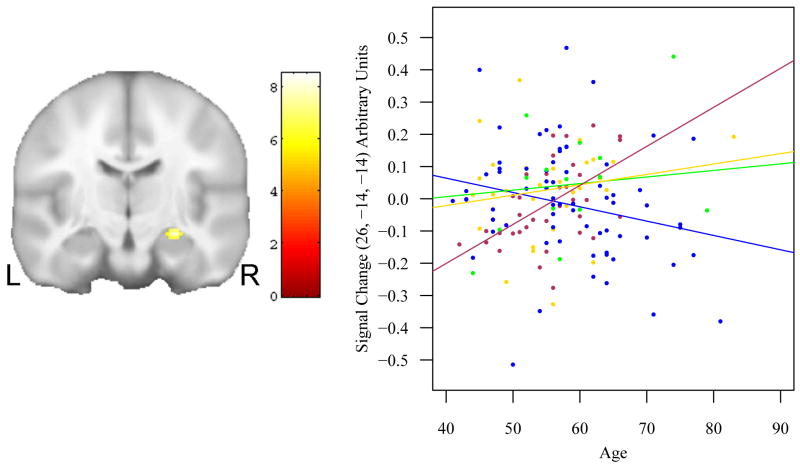
Fig. 4.
A coronal view indicates the single region (right hippocampus), that exhibited a significant risk × age interaction for ENC. The scatter-plot and rank-estimation fitted lines to the right further describes the result. Maroon: FH+, APOE4+; green: FH-, APOE4+; gold: FH+, APOE4-; blue: FH-, APOE4-. Both APOE4 positive groups show an increase with age; the FH-, APOE4- group exhibited a decrease with age. The result is focal in comparison to Fig. 3, suggesting the main effects of APOE and FH only weakly interact with age.

