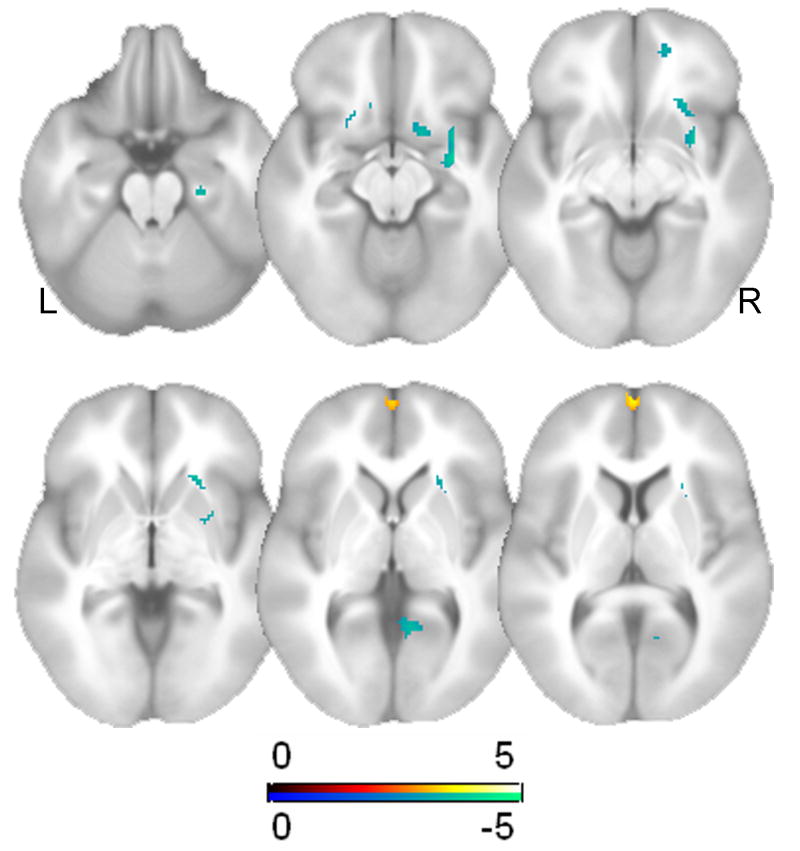
Fig. 6.
Displays T maps for the results of the multiple regression analysis of aging effects (n = 203) for SA. The analyses were restricted to voxels that displayed a main effect of task, which are displayed in Fig. 5. Hot colors represent age-related declines in brain activity, whereas cold colors represent age-related increases in brain activity.

