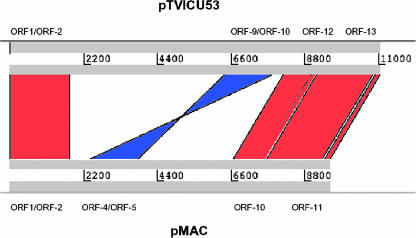
FIG. 2.
Synteny map of pTVICU53 and pMAC. Sequences of pTVICU53 and pMAC were compared by WebACT (http://www.webact.org/WebACT/home) and visualized by ACT (7). Red indicates similar organization, whereas blue represents inversions. Corresponding ORFs are indicated above and below nucleotide number lines.

