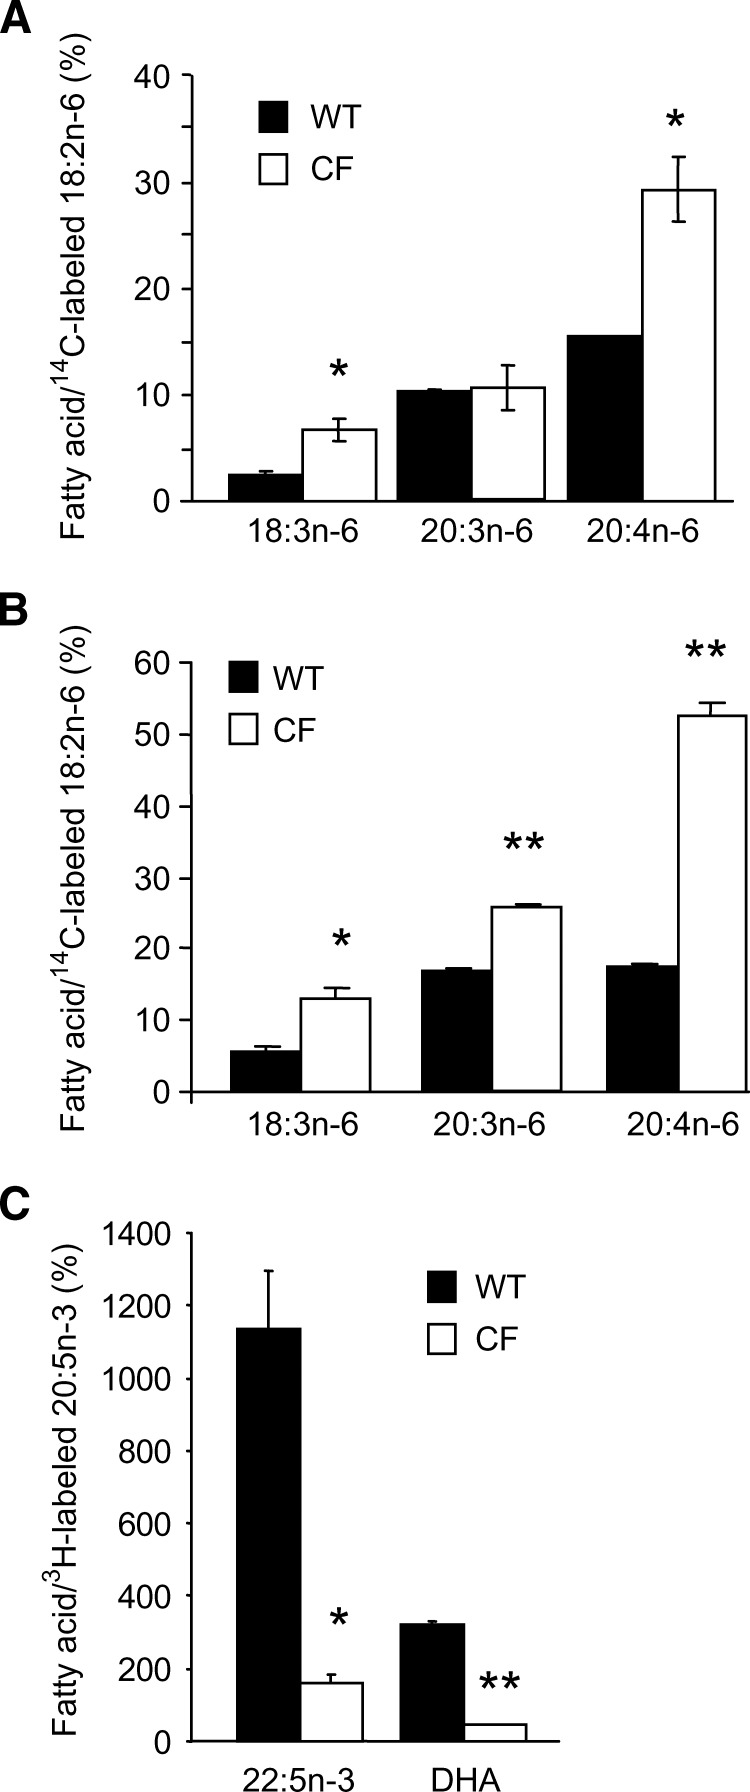
Fig. 5.
Analysis of fatty acid metabolism. For analysis of the n-6 pathway, 16HBE cells were incubated with [14C]linoleic acid (4.9 μM, 0.5 μCi) for 4 h in lipid-free cell culture media, washed twice, and incubated for 20 h in serum-containing media. Lipids were extracted and methylated. Fatty acids were then separated by HPLC, and radioactivity was quantified by scintillation counting, as described in the Methods section. Results are shown for cells cultured in 10% horse serum (A) and in 10% FBS (B). Data are representative of two experiments, with each condition tested in triplicate and expressed as mean ± SEM. C: Results from analysis of n-3 fatty acid synthesis in16HBE cells cultured in 10% horse serum, where cells were incubated with [3H]eicosapentaenoic acid (4.5 μM, 0.5 μCi) and analyzed as above. Data are expressed as mean ± SEM, n = 2. * P < 0.05, ** P < 0.01.

