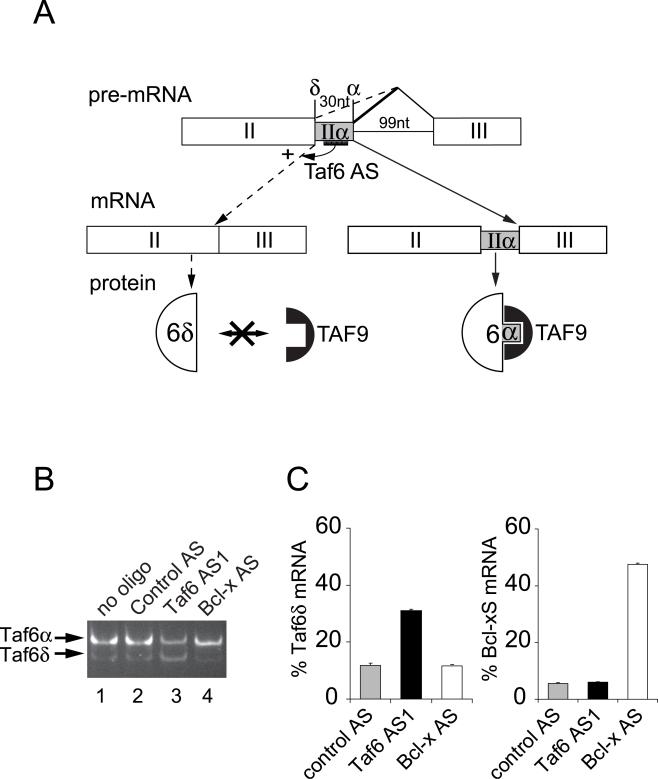
Figure 1. Specific control of endogenous TAF6 alternative splicing by modified antisense RNA oligonucleotides in living cells.
(A) The region of the TAF6 pre-mRNA that includes two alternative 5′ splice sites (SSs) that produce either the constitutive α splice variant or the alternative δ splice variant is schematically depicted. Selection of an intron-proximal α 5′ splice site (SS) results in production of the α isoform of TAF6 (at right) whereas the selection of the proximal δ 5′ SS results in the production of the δ isoform (at left). The SSOs that base pair with the alternative exon forces splicing from the distal 5′ SS and induces expression of the endogenous TAF6δ isoform (at left). The protein produced by the major splice variant, TAF6α, can interact with the TFIID subunit, TAF9 via its histone fold domain. In contrast, TAF6δ lacks 10 amino acids of helix 2 of its histone fold motif and therefore cannot interact with TAF9. (B) Antisense RNA oligonucleotides induce endogenous TAF6δ mRNA expression. HeLa cells were transfected with 200 nM oligonucleotides directed against: the alternative exon II (exon IIα) of the TAF6 gene (Taf6 AS1), the Bcl-x gene (Bcl-x AS), or a scrambled control oligonucleotide (Control AS). 24 hours post-transfection total RNA was isolated and subjected to RT-PCR with primers that amplify both the TAF6α and the alternative TAF6δ mRNAs. (C) Specificity of TAF6 splice site switching oligonucleotides. HeLa cells were transfected with antisense RNA oligonucleotides as in A. RT-PCR was perfomed with primers sets that amplify the both the α and δ TAF6 splice variants, or both the Bcl-xS and Bcl-xL splice variants. PCR products were separated by microfluidity and analyzed using a 2100 Agilent bioanalyzer. The ratio of TAF6δ mRNA over total TAF6 mRNA and the ratio of Bcl-Xs mRNA over total Bcl-X mRNA are expressed on the y-axis. The values from cells treated with scrambled control (grey bars), Taf6 AS1 (black bars), or Bcl-X AS (white bars) are shown. Error bars represent the standard deviation of three independent transfections.

