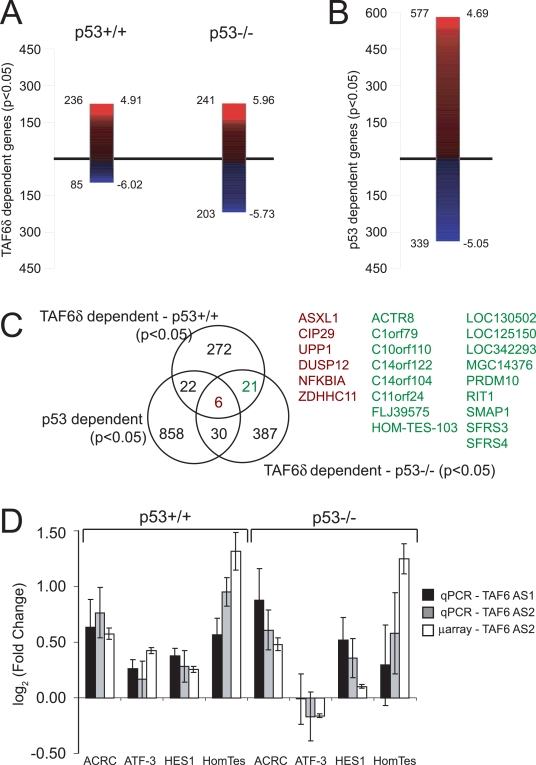
Figure 6. Endogenous TAF6δ expression induces apoptosis in the absence of p53.
(A) Transcriptome analysis following TAF6 SSO in HCT-116 p53+/+ and p53−/− cells. Expression levels of mRNAs from cells treated with oligonucleotide Taf6AS2 were individually compared to control oligonucleotide-treated HCT-116 samples by genome-wide microarray analysis. The absolute number of probes detecting statistically significant (p<0.05) up- or down-regulation following splice-site selection is shown to the left of each bar; the maximum positive or negative logarithmic (base two) fold-change is shown to the right. The red gradient indicates positive, and the blue gradient negative fold changes in expression. (B) Transcriptome analysis following TAF6 SSO in HCT-116 cells and selecting for those genes that show significant regulation between the HCT-116 p53 +/+ versus HCT-116 p53 −/− cells irrespective of TAF6δ expression. Labels as in (A). (C) Venn-Diagram displaying the overlap between the three different target gene repertoires shown in (A) and (B). (D) Verification of gene expression changes by quantitative real-time RT-PCR. HCT-116 p53+/+ and HCT-116 p53−/− cells were transfected with two distinct antisense oligonucleotides that induce endogenous TAF6δ; Taf6 AS1 (grey bars), Taf6 AS2 (black bars). White bars indicate values from microarray experiments for comparison. 18 hours post-transfection total RNA was extracted and the levels of the indicated mRNAs were analyzed by quantitative real-time PCR with respect to the levels from cells treated with the control oligonucleotide. Error bars indicate standard deviation of three independent transfections.

