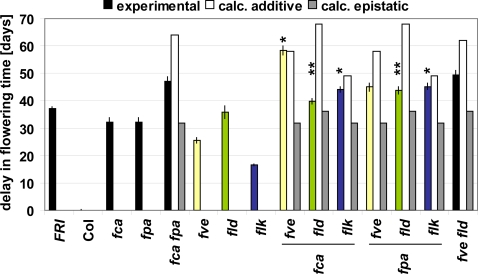
Figure 2. Flowering time of autonomous pathway single and double mutants.
Flowering time of the indicated mutant plants grown under long day conditions in a greenhouse was measured in days to flowering (opening of the first flower). Flowering time is indicated as the average delay in flowering relative to the Col wild type +/− standard error of the mean. (yellow (fve), green (fld), blue (flk), and black (all others) bars). Col was flowering at 39 days. White and grey bars indicate predicted flowering time for calculated additive and epistatic scenarios, respectively. *, additive interaction; **, epistatic interaction.

