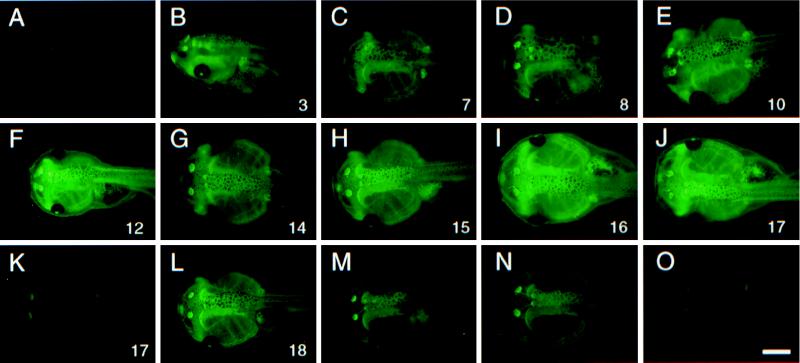
Figure 1.
CMV:GFP transgenic tadpoles. (A) Control nontransgenic tadpole. (B–L) F1 CMV:GFP tadpoles from 10 different lines. Numbers in the right bottom corner represent the line number in Table 1. (K) Weak-expressing tadpole from line 17. (J) A strong-expressing tadpole from line 17. (M–O) Three F0 CMV:GFP tadpoles. All panels represent dorsal views of 8-day-old tadpoles taken at the same  -s exposure, except for K, which was taken at ¼-s exposure. (Scale bar represents 500 μm.)

