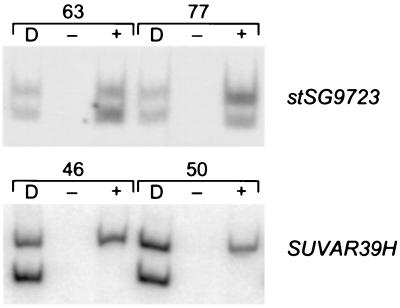
Figure 2.
Gene expression in nonrandomly inactivated primary fibroblast cell lines. For each cell line, DNA and cDNA samples were PCR amplified and then digested with the appropriate restriction enzyme to differentiate alleles. D indicates amplification of DNA and + or − refers to RNA that has been amplified with or without prior reverse transcription. Each cell line tested is identified by a number, as described previously (25).

