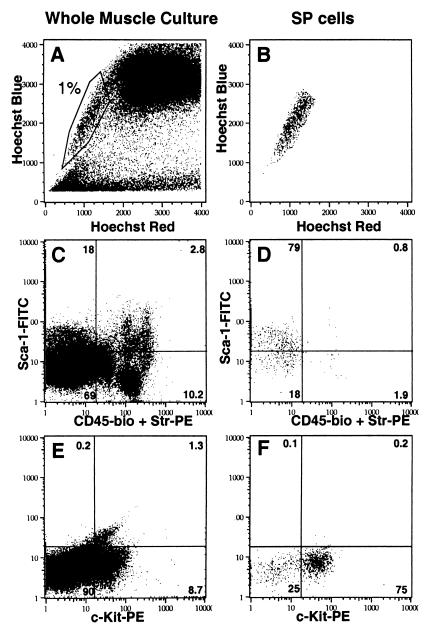
Figure 5.
Flow cytometric analysis of muscle cell cultures. (A, C, and E) Whole culture. (B, D, and F) Hoechst low SP cells. The percentage of cells in each quadrant is indicated in the Upper Right corner. (A) Whole muscle cell culture stained with Hoechst 33342. The indicated region is analogous to the SP fraction of whole bone marrow and represents about 1% of the culture. (B) SP fraction as gated in A. (C) Whole culture stained with anti-Sca-1-FITC and anti-CD45-biotin + Str-PE. (D) Anti-Sca-1-FITC and anti-CD45 staining of the SP fraction. (E) Whole culture stained with anti-c-Kit-PE alone. (F) c-Kit staining of the SP fraction.

