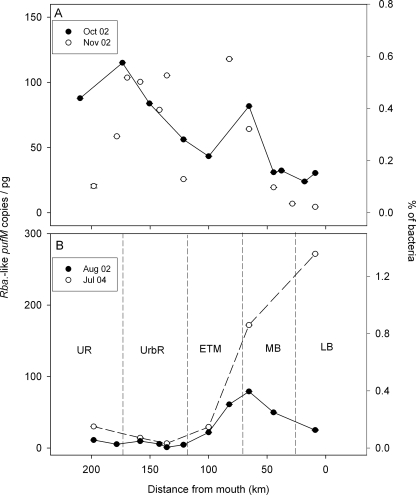
FIG. 3.
Distribution of Rhodobacter-like pufM ecotypes, normalized to pg of total DNA, in the Delaware estuary in autumn (A) or summer (B). Error bars, each based on the standard error for four qPCRs, are smaller than the symbols. Dashed vertical lines in panel B delineate the five regions of the estuary: LB, lower bay (0 to 25 km); MB, midbay (25 to 70 km); ETM, turbidity maximum (70 to 115 km); UrbR, urban river (115 to 175 km); UR, upper river (175 to 215 km). The percentage of bacteria was calculated assuming 2 fg DNA per bacterial cell.

