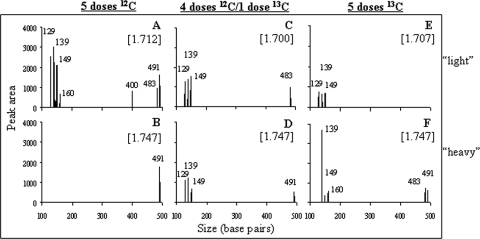
FIG. 2.
Microbial community composition represented by T-RFLP profiles from three fractions collected from CsCl gradients containing DNA extracted from soils receiving 5 doses of 100 μg [12C]benzoic acid (A), 4 doses of 100 μg [12C]benzoic acid and a final 100 μg dose of [13C]benzoic acid (B), or 5 doses of 100 μg [13C]benzoic acid (C). The buoyant densities (grams per milliliter) of the fractions are shown in brackets.

