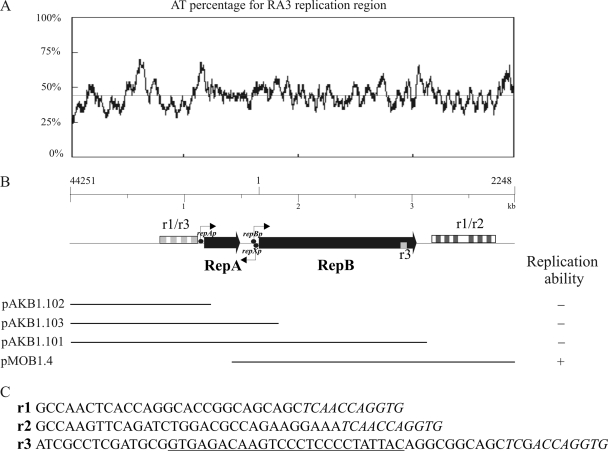
FIG. 3.
Replication region of RA3. (A) AT percentage plot for the region from 44251 to 2248 encompassing the replication module. The x axis indicates the position in the RA3 sequence. (B) Functional mapping of the replication region. The organization of the replication module is depicted with thin black arrows marking the putative transcription start points, black circles marking putative promoters, and combinations of the repetitive sequences indicated by boxes as follows: r1, white; r2, dark grey; r3, light grey. The bottom part of the panel illustrates the DNA fragments cloned into a high-copy-number vector (pMB1 origin) and tested for the ability to replicate in E. coli C2110 (polA). The results of the tests are summarized on the right. (C) Repetition units r1, r2, and r3. The sequence that is the same in all three units is in italics; the fragment of repetition unit r3 found at the 3′ end of repBRA3 is underlined.

