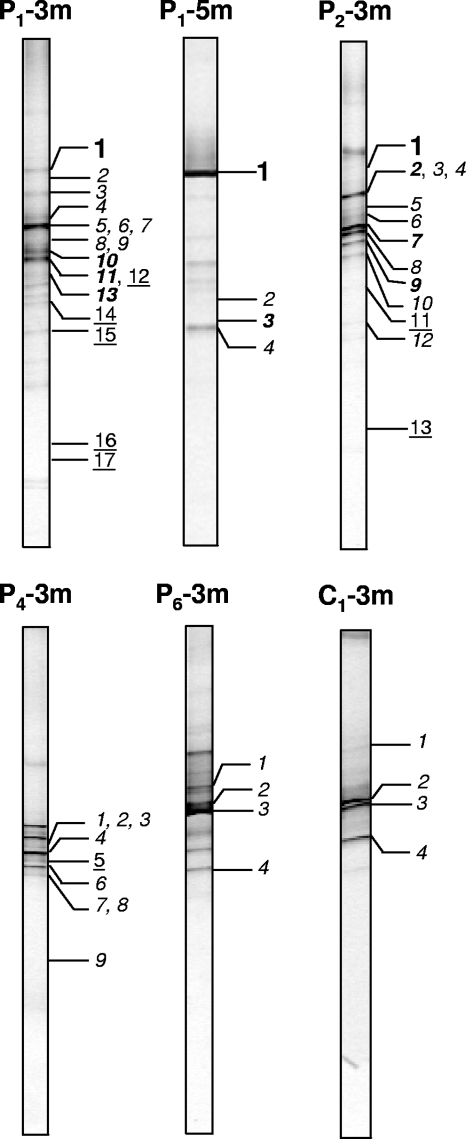
FIG. 3.
Linking eukaryotic clone identities to environmental DGGE profiles (20 to 35% denaturant gradient). The designations above the DGGE tracks indicate the sampling location and depth (Fig. 1). The identities of the numbered bands are shown in Fig. 5. Bold roman numbers indicate Cercozoa-like clones, bold italic numbers indicate Chlorophyta-like clones, light italic numbers indicate funguslike clones, and underlined numbers indicate other eukaryotes.

