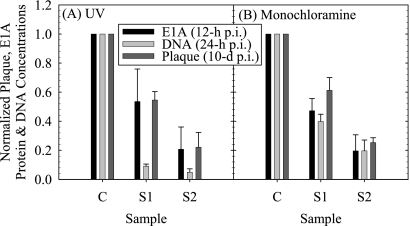
FIG. 4.
Sample composite averages and standard errors of normalized viral E1A protein (12 h p.i.) and DNA (24 h p.i.) concentrations and survival ratios for either untreated control (C) or virions treated (S1 and S2) with either UV light (A) or monochloramine (B). Average IT and CT values for samples S1 and S2 are given in Tables 3 and 4, respectively.

