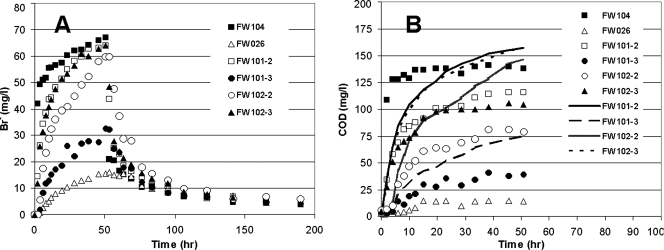
FIG. 3.
A tracer test performed with Br− on days 801 to 803 shows the hydraulic connection between injection well FW104, extraction well FW026, and MLS wells and biodegradation of ethanol. (A) Changes in bromide concentrations (21). (B) Comparison of measured COD (symbols) and calculated COD (lines) concentrations based on the COD-versus-Br− ratio (2.46 g/g).

