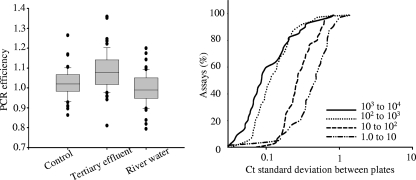
FIG. 5.
Factors potentially influencing quantitative inaccuracies as observed with primers and samples designed to establish the predictive CT equation. In the left panel, a box plot shows the distribution of PCR efficiency for target organisms spiked into gDNA from complex environmental waters and a control (no background). The right panel shows the cumulative frequency distributions of the standard deviations of CT determined between three separate OpenArray plates with various transcript concentrations.

