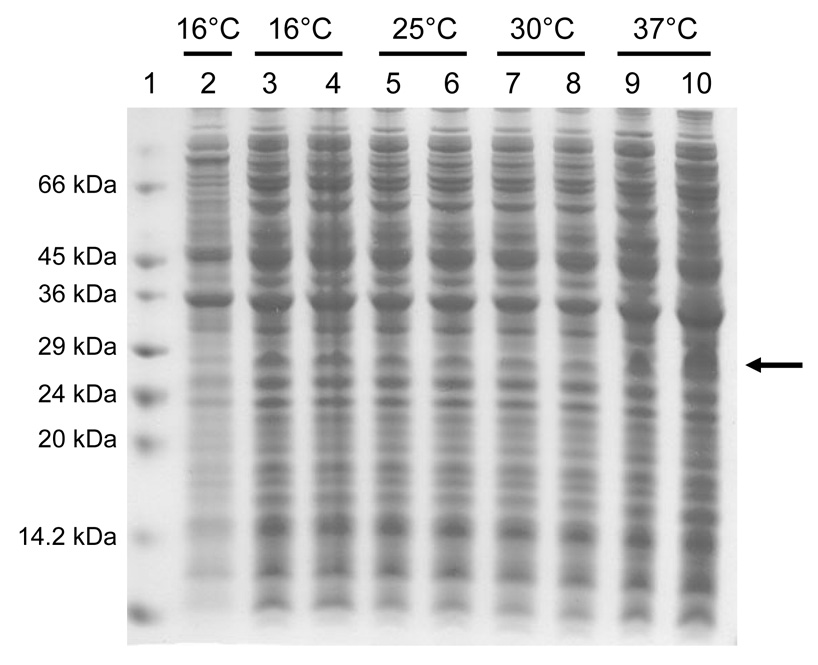
Fig. 3.

Electrophoretic profile of total cellular proteins obtained from the E. coli strain C41(DE3) expressing the TM4-Cx43CT at different temperatures (labeled above each lane) and IPTG concentrations 4 hrs after induction. Lane 2 is the control (no IPTG). Lanes 3, 5, 7, and 9 were induced with a final IPTG concentration of 0.5 mM and lanes 4, 6, 8, and 10 were induced with a final IPTG concentration of 1.0 mM. Lane 1 contains the protein molecular weight marker. The arrow represents the location of the TM4-Cx43CT.
