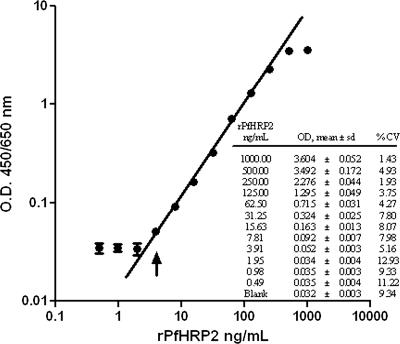
FIG. 1.
Log versus log scale plot of a standard curve for results from 10 independent assay repetitions using rPfHRP2 in PBS/T. The dose response is linear for concentrations up to 250 ng/ml rPfHRP2, which corresponds to an OD of 2.28, above which the dose response becomes nonlinear. The lower LOD, i.e., the point at which the analysis becomes just feasible, is 3.91 ng/ml (arrow). The curve fitted to a true line without any data transformation.

