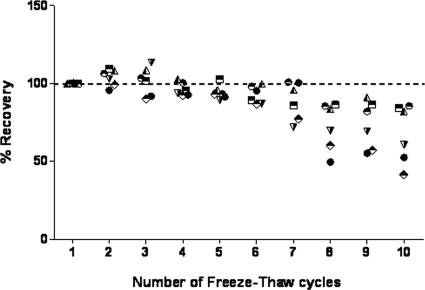
FIG. 4.
Effect of multiple freeze-thaw cycles on a 10-μg/ml stock of rPfHRP2 antigen. The dashed line represents 100% concentration at cycle 1. The scatter plots represent percent recoveries at target concentrations between 7.8 and 250 ng/ml. The percent recoveries were significantly different from the fifth freeze-thaw cycle onward (P ≤ 0.05; paired t test). •, 7.8;  , 15.1; ◭, 31.3; ⬘, 62.5; ⬒, 125.0; ◓, 250.0.

