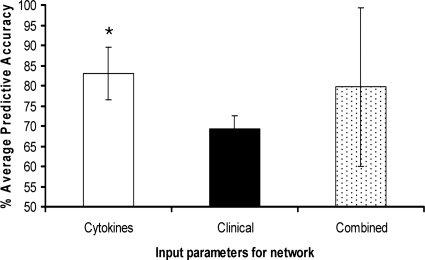
FIG. 3.
Average predictive accuracies for sets of cytokine, clinical, and combined cytokine and clinical parameters for predicting ICU patient outcome. Neural network analysis of each set of input parameters was repeated 5 times, and a mean predictive accuracy calculated. Each analysis used a randomized data set to train the network and then test its ability to differentiate between sepsis and nonsepsis control patients. The significance of each set of input parameters was assessed by using the chi-square test plus Bonferroni's correction (a P value of 0.008). Error bars show 95% confidence limits. *, significant result (P < 0.0001).

