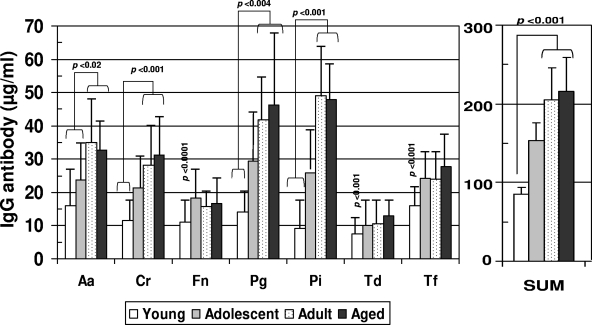
FIG. 3.
Serum IgG antibodies to individual oral bacteria and total antibodies to this battery (SUM) in nonhuman primates categorized on the basis of age (see the legend to Fig. 1). Bars represent mean antibody levels; error bars, 1 standard deviation. Statistical differences are depicted on the graph. For bacterium abbreviations, see the legend to Fig. 2.

