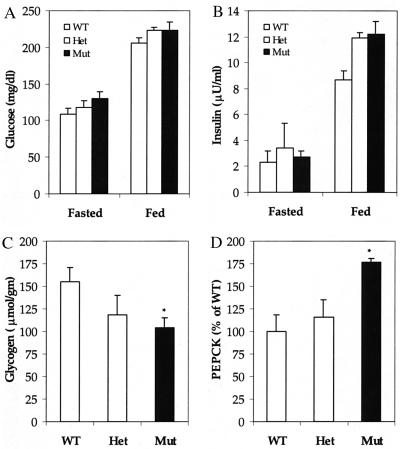
Figure 6.
Plasma glucose, insulin, liver glycogen, and PEPCK mRNA levels. (A and B) Eight-week-old male mice were fasted for 16 hr or fed ad lib, and glucose (A) and insulin (B) levels were determined. μU, microunit. Fasted: n = 5 for wild type (WT); n = 6 for heterozygous mutant (Het); n = 6 for homozygous mutant (Mut). Fed: n = 6 for WT; n = 5 for Het; n = 5 for Mut. (C) Eight-week-old male, ad-lib fed mice were sacrificed, livers were harvested, and glycogen levels were quantitated. n = 3 for WT; n = 3 for Het; n = 3 for Mut. (D) PEPCK mRNA levels were quantitated by Northern blot analysis of total RNA prepared from fasted mouse liver. n = 3 for WT; n = 3 for Het; n = 3 for Mut. The mRNA level in WT is taken as 100%. Data are presented as mean ± SEM. *, Differences were considered statistically significant at P < 0.05.

