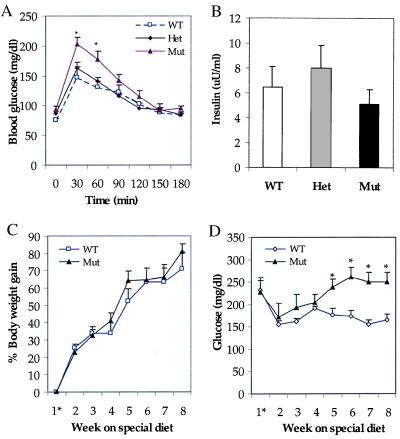
Figure 7.
Glucose homeostasis in GKRP-mutant mice. (A) Glucose tolerance test showing elevated blood glucose levels in Mut mice as compared with WT and Het mice. n = 7 for WT; n = 7 for Het; n = 13 for Mut. (B) Plasma insulin levels in mice 30 min after glucose injection, showing the absence of significant changes. n = 4 for WT; n = 4 for Het; n = 4 for Mut. (C and D) Effect of high-sucrose + high-fat feeding on body weight and plasma glucose levels. Although both groups gained body weight at similar rates (C), the plasma glucose levels are significantly elevated in Mut mice as compared with WT mice (D). n = 5 for WT; n = 5 for Mut. 1* indicates after weaning. Data represent mean ± SEM. *, Differences were considered statistically significant at P < 0.05.

