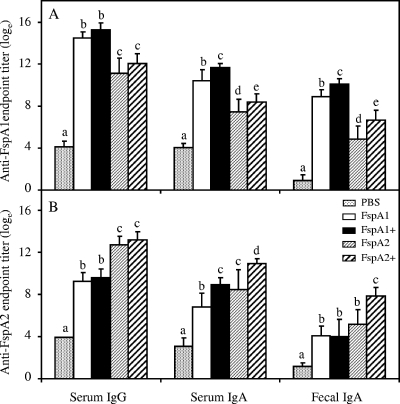
FIG. 1.
Comparative immunogenicity of 100 μg of FspA1 and FspA2 proteins with and without LTR192G. Plus signs indicate proteins that were delivered with the adjuvant LTR192G. All group mean comparisons made with PBS were significantly different (P < 0.05). No responders were observed for animals receiving PBS, while 100% of the animals were categorized as responders under all conditions except fecal IgA, for which the following responder levels were shown: for anti-FspA1 in FspA2-immunized mice, 86%; for anti-FspA2 in FspA1-immunized mice, 85%; for anti-FspA2 in FspA1-plus-LTR192G-immunized mice, 78%; and for anti-FspA2 in FspA2-immunized mice, 78%. Letters a to e indicate pairwise comparisons for each test; bars with different letters within a comparison graph are significantly different (P < 0.05).

